

28 Mar Shoe Carnival’s Q4 Earnings Reaches Upper End Of Guidance
Shoe Carnival Inc. reported earnings rose 30.1 percent on an adjusted basis, hitting the high end of guidance. Same-sore sales dipped 0.5 percent
Fourth Quarter Highlights
- Net sales increased $9.0 million, or 3.9 percent, to $243.2 million
- Comparable store sales decreased 0.5 percent
- Gross profit margin was 28.9 percent, which included a $3.3 million gain on insurance proceeds related to hurricane affected stores
- Net loss was $3.9 million, or $0.24 per diluted share, which included non-cash impairment charges of $3.4 million for 30 underperforming stores, $6.3 million of additional expense associated with the enactment of the U.S. Tax Cuts and Jobs Act of 2017 (the “Tax Act”) in December 2017 and the $3.3 million gain on insurance proceeds referenced above
- Non-GAAP adjusted net income, excluding the items referenced in the preceding bullet point, was $1.7 million, or adjusted earnings per diluted share of 11 cents a share, in the fourth quarter of fiscal 2017, compared to non-GAAP adjusted net income of $1.3 million, or adjusted earnings per diluted share of 7 cents, in the fourth quarter of fiscal 2016
- Inventory was down $19.1 million, or 5.2 percent on a per-store basis
- Company closed 16 underperforming stores in the quarter
- Cash and cash equivalents of $48.3 million with no outstanding bank debt as of February 3, 2018
“2017 was a transitional year for Shoe Carnival, as we refined our strategic direction to create an even more fun, exciting and memorable experience for our customers, with the goal of engaging them across our omni-channel offering to position us for growth over the next several years,” said Cliff Sifford, Shoe Carnival’s president and CEO. “Our team executed well throughout the year in the face of external challenges, particularly as our business continues to recover from the hurricanes in certain markets like Puerto Rico. In addition, we strategically pulled back on our promotional cadence during the year, including the decision to close our doors on Thanksgiving Day. We are also pleased to have continued to enhance value for shareholders through our share repurchase and quarterly dividend programs. For 2018, our team remains focused on efficiently managing our business to generate increased net sales and profitability.”
Fourth Quarter Financial Results
The company reported net sales of $243.2 million for the 14-week fourth quarter of fiscal 2017, a 3.9 percent increase, compared to net sales of $234.2 million for the 13-week fourth quarter of fiscal 2016. Sales of approximately $13.0 million were recorded in the extra week of the fiscal 2017 fourth quarter. Comparable store sales for the 13-week period ended January 27, 2018 decreased 0.5 percent compared to the 13-week period ended January 28, 2017.
Gross profit margin for the fourth quarter of fiscal 2017 increased to 28.9 percent compared to 27.5 percent in the fourth quarter of fiscal 2016. Merchandise margin increased 1.4 percent and buying, distribution and occupancy expenses remained flat as a percentage of net sales compared to the fourth quarter of fiscal 2016. Gross profit margin in the fourth quarter of fiscal 2017 included a $3.3 million gain on insurance proceeds related to hurricane affected stores. Excluding the gain on insurance proceeds, adjusted gross profit margin percentage would have been flat for the fourth quarter of fiscal 2017 compared to the fourth quarter of fiscal 2016.
Selling, general and administrative expenses (“SG&A”) for the fourth quarter of fiscal 2017 increased $4.1 million to $70.0 million, or 28.8 percent of net sales. SG&A in the fourth quarter of fiscal 2017 included non-cash impairment charges of $3.4 million for 30 underperforming stores and a $1.9 million increase in stock-based compensation expense due to the enactment of the Tax Act and its impact on the anticipated vesting of the company’s outstanding performance-based restricted stock. SG&A in the fourth quarter of fiscal 2016 included non-cash impairment charges of $3.6 million for seven Puerto Rico stores. Excluding non-cash impairment charges and the additional stock-based compensation expense recorded in the fourth quarter of fiscal 2017, and excluding non-cash impairment charges recorded in the fourth quarter of fiscal 2016, adjusted SG&A increased $2.4 million to $64.7 million, or 26.6 percent of net sales, in the fourth quarter of fiscal 2017.
In December 2017, the Tax Act was enacted, which reduced the company’s corporate statutory tax rate from 35 percent to 21 percent. This rate change primarily impacted SG&A and income tax expense during the fourth quarter of fiscal 2017. The company re-measured its deferred tax assets and liabilities using the new, lower tax rate, which resulted in a $4.4 million additional charge to income tax expense in the fourth quarter of fiscal 2017. The company’s income tax expense for the fourth quarter of fiscal 2017 was $4.0 million and was $18.5 million for the full fiscal year 2017. Excluding the additional charge to income tax expense, and excluding the tax effects of the gain on insurance proceeds, non-cash impairment charges and additional stock-based compensation expense described above, the company’s adjusted income tax expense for the fourth quarter of fiscal 2017 was $433,000 and was $14.9 million for the full fiscal year 2017.
Net loss for the fourth quarter of fiscal 2017 was $3.9 million, or a loss of $0.24 per diluted share, which included the non-cash impairment charges, additional stock-based compensation expense and income tax expense associated with the enactment of the Tax Act and the gain on insurance proceeds described above, which impacted earnings by $0.35 per diluted share in the aggregate. Adjusted net income was $1.7 million, or adjusted earnings per diluted share of $0.11, in the fourth quarter of fiscal 2017. For the fourth quarter of fiscal 2016, net loss was $0.9 million, or a loss of $0.05 per diluted share, which included non-cash impairment charges of $0.12 per diluted share (net of tax). Adjusted net income was $1.3 million, or adjusted earnings per diluted share of $0.07, in the fourth quarter of fiscal 2016.
Fiscal Year 2017 Financial Results
Net sales during the 53-week fiscal 2017 increased $18.1 million to $1.019 billion compared to $1.001 billion in the 52-week fiscal 2016. Comparable store sales for the 52-week period ended January 27, 2018 increased 0.3 percent compared to the 52-week period ended January 28, 2017. Net income for fiscal 2017 was $18.9 million, or $1.15 per diluted share, compared to net income of $23.5 million, or $1.28 per diluted share, in fiscal 2016. Adjusted net income was $24.5 million, or adjusted earnings per diluted share of $1.49, for fiscal 2017, compared to $25.7 million, or adjusted earnings per diluted share of $1.40, for fiscal 2016.
When it reported third-quarter results on March 27, the retailer said it expected net sales to be in the range of $1.020 billion to $1.025 billion, with comparable store sales flat to up low single digits. Earnings per diluted share for the fiscal year were expected to be in the range of $1.42 to $1.49.
Store Growth
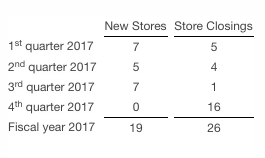
The company opened 19 stores and closed 26 stores during fiscal 2017 compared to opening 19 stores and closing nine stores during fiscal 2016.
Store openings and closings by quarter for the fiscal year are as follows:
Share Repurchase Program
For the fiscal year ended February 3, 2018, the company repurchased approximately 1.3 million shares of its common stock, at an average price of $23.66 per share, for a total cost of $29.8 million. On December 14, 2017, the company’s Board of Directors authorized a new share repurchase program for up to $50.0 million of its outstanding common stock, effective January 1, 2018. The new share repurchase program replaced the existing $50.0 million share repurchase program which expired in accordance with its terms on December 31, 2017. As of February 3, 2018, the company had $50.0 million available for future stock repurchases under the new stock repurchase program.
Fiscal 2018 Earnings Outlook
The company expects fiscal 2018 net sales to be in the range of $1.013 billion to $1.023 billion, with comparable store sales flat to up low single digits. Earnings per diluted share for the fiscal year are expected to be in the range of $1.85 to $2.00. Fiscal 2017 earnings per diluted share were $1.15 and adjusted earnings per diluted share were $1.49.