23 May 2019 TJX’s Q1 Exceeds Plan, Outlook Lifted
The TJX Companies Inc. reported first-quarter earnings that beat expectations and raised its outlook.
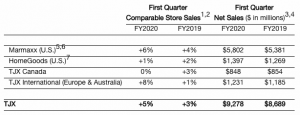
Net sales for the first quarter of fiscal 2020 increased 7 percent to $9.3 billion, exceeding Wall Street’s consensus estimate of $9.22 billion. Consolidated comparable store sales increased 5 percent over last year’s 3 percent increase. Net income for the first quarter was $700 million, and diluted earnings per share were 57 cents, versus the prior year’s 56 cents and ahead of Wall Street’s average target of 55 cents.
Ernie Herrman, chief executive officer and president of The TJX Companies, Inc., stated, “We are very pleased with our continued strong performance in the first quarter, as both our consolidated comparable store sales increase of 5 percent and earnings per share of $.57 came in well above our expectations. It is terrific to see the continued strength of our largest division, Marmaxx, with an outstanding 6 percent comp increase. Further, Marmaxx’s apparel and home categories were both very strong. Once again this quarter, customer traffic was the primary driver of our consolidated comp increase and was up at each of our four major divisions. We believe this is a great indicator of the enduring appeal of our great values on an eclectic and exciting mix of merchandise and our treasure-hunt shopping experience, as well as the resiliency of our off-price retail model. With our above-plan first quarter results, we are raising our full-year earnings per share outlook. We are in an excellent position to take advantage of the abundant buying opportunities we are seeing in the marketplace for quality, branded merchandise and to keep flowing fresh, exciting assortments to our stores and online. We have many initiatives underway to keep driving sales and customer traffic, and feel great about our ability to continue gaining market share around the world!”
Sales by Business Segment
Impact of Foreign Currency Exchange Rates
Changes in foreign currency exchange rates affect the translation of sales and earnings of the Company’s international businesses into U.S. dollars for financial reporting purposes. In addition, ordinary course, inventory-related hedging instruments are marked to market at the end of each quarter. Changes in currency exchange rates can have a material effect on the magnitude of these translations and adjustments when there is significant volatility in currency exchange rates.
The movement in foreign currency exchange rates had a one percentage point negative impact on consolidated net sales growth in the first quarter of Fiscal 2020 versus the prior year. The overall net impact of foreign currency exchange rates had a neutral impact on first quarter Fiscal 2020 earnings per share, compared with a $.01 positive impact last year.
A table detailing the impact of foreign currency on TJX pretax earnings and margins, as well as those of its international businesses, can be found in the Investors section of tjx.com.
The foreign currency exchange rate impact to earnings per share does not include the impact currency exchange rates have on various transactions, which the Company refers to as “transactional foreign exchange.”
Margins
For the first quarter of Fiscal 2020, the Company’s consolidated pretax profit margin was 10.1 percent, a 0.9 percentage point decrease versus 11.0 percent in the prior year.
Gross profit margin for the first quarter of Fiscal 2020 was 28.5 percent, a 0.4 percentage point decrease versus the prior year. As expected, gross margin was negatively impacted by increased supply chain and freight costs.
Selling, general and administrative (SG&A) costs as a percent of sales for the first quarter were 18.3 percent, a 0.5 percentage point increase versus the prior year. The increase in SG&A was primarily due to store wage increases, an unfavorable year-over-year comparison on a gain related to a lease buyout last year, and incremental IT investments.
Inventory
Total inventories as of May 4, 2019, were $5.1 billion, compared with $4.4 billion at the end of the first quarter last year. Consolidated inventories on a per-store basis as of May 4, 2019, including the distribution centers, but excluding inventory in transit, the Company’s e-commerce sites, and Sierra stores, were up 6 percent on a reported basis (up 7 percent on a constant currency basis). Entering the second quarter, the Company is in an excellent position to take advantage of the terrific opportunities it sees in the marketplace for quality, branded merchandise.
Second Quarter and Full-Year Fiscal 2020 Outlook
For the second quarter of Fiscal 2020, the Company expects diluted earnings per share to be in the range of $.61 to $.62, a 5 percent to 7 percent increase over the prior year’s $.58. The Company expects the combination of incremental freight costs and store wage increases to negatively impact second quarter EPS growth by 2 percent to 3 percent. This EPS outlook is based upon estimated comparable store sales growth of 2 percent to 3 percent on a consolidated basis and at Marmaxx.
For the 52-week fiscal year ending February 1, 2020, the Company is raising its guidance for diluted earnings per share to be in the range of $2.56 to $2.61. This would represent a 5 percent to 7 percent increase over the prior year’s $2.43, which included a $.02 negative impact from a pension settlement charge. The Company now expects diluted earnings per share to increase 4 percent to 7 percent over the prior year’s adjusted $2.45, which excluded the pension settlement charge. This guidance reflects an assumption that the combination of incremental freight costs and store wage increases will negatively impact EPS growth by 3 percent to 4 percent. This EPS outlook is based upon estimated comparable store sales growth of 2 percent to 3 percent on a consolidated basis and at Marmaxx.
The company’s earnings guidance for the second quarter and full-year Fiscal 2020 assumes that currency exchange rates will remain unchanged from the levels at the beginning of the second quarter.
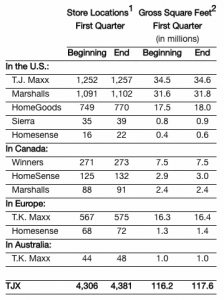
Stores by Concept
During the first quarter ended May 4, 2019, the company increased its store count by 75 stores to a total of 4,381 stores. The Company increased square footage by 4 percent over the same period last year.


