14 Mar Genesco Q4 Exceeds Guidance On Journeys Momentum
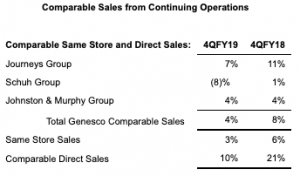
Genesco Inc. reported earnings excluding non-recurring items rose 18.8 percent in the fourth quarter. Comps grew 4 percent, led by a 7 percent climb at the Journeys chain.
Genesco Inc. reported GAAP earnings from continuing operations per diluted share of $1.53 for the three months ended February 2, 2019, compared to earnings from continuing operations per diluted share of $2.51 in the fourth quarter last year.
Adjusted for the Excluded Items in both periods, the company reported fourth quarter earnings from continuing operations per diluted share of $2.18, compared to earnings from continuing operations per diluted share of $1.85 last year.
GAAP earnings from continuing operations per diluted share were $2.63 for the year ended February 2, 2019, compared to earnings from continuing operations per diluted share of $1.90 for the year ended February 3, 2018. Adjusted for the Excluded Items in both periods, the company reported Fiscal 2019 earnings from continuing operations per diluted share of $3.28, compared to earnings from continuing operations per diluted share of $2.67 for Fiscal 2018.
Robert J. Dennis, Genesco chairman, president and chief executive officer, said: “Fiscal 2019 was an incredibly significant and successful year for Genesco highlighted by several important accomplishments and a turnaround in the trajectory of our business. The strength of our U.S. retail footwear concepts fueled our highest annual comparable sales increase in three years. Our top-line performance included positive store comps, which along with our recent cost reduction efforts allowed us to leverage our brick and mortar expense structure. This helped us deliver EPS above expectations and up nicely over last year, even as we incurred a meaningful amount of bonus expense compared with almost none in Fiscal 2018.
“With the sale of the Lids Sports Group completed in early February, we began Fiscal 2020 as a footwear- focused company. Our strong strategic positioning, close connection with our customers and enduring leadership positions are what make each of our footwear businesses distinctive. With the new strategic course we have set for Genesco, we believe we are now in a stronger position to unlock the potential of our combined footwear businesses, utilize the platforms we have for future growth and generate greater shareholder value this year and over the long-term.”
Fourth Quarter Review
Net sales from continuing operations for the fourth quarter of Fiscal 2019 decreased 2 percent to $675 million from $689 million in the fourth quarter of Fiscal 2018. Excluding the extra week from last year’s 14-week quarter and the impact of lower exchange rates this year, revenue was up 4 percent. Comparable sales from continuing operations increased 4 percent, with stores up 3 percent and direct up 10 percent. Direct-to-consumer sales were 14 percent of total retail sales from continuing operations for the quarter, compared to 13 percent last year.
Fourth quarter gross margin this year was 46.7 percent, up 70 basis points, compared with 46.0 percent last year. The increase as a percentage of sales reflects decreased markdowns for Journeys Group and less promotional sales for Schuh Group, partially offset by increased markdowns and shipping and warehouse expense at Johnston & Murphy Group.
Selling and administrative expense for the fourth quarter this year was 38.9 percent, up 80 basis points, compared to 38.1 percent of sales for the same period last year. The increase as a percentage of sales reflects higher bonus expense, partially offset by strong leverage from rent and selling salaries.
Genesco’s GAAP operating income for the fourth quarter was $50.6 million this year compared with $48.1 million last year. Adjusted for the Excluded Items in both periods, operating income for the fourth quarter was $58.5 million this year compared with $54.4 million last year. Adjusted operating margin was 8.7 percent of sales in the fourth quarter of Fiscal 2019 and 7.9 percent last year.
The effective tax rate for the quarter was 40.6 percent in Fiscal 2019 compared to -3.9 percent last year. The adjusted tax rate, reflecting Excluded Items, was 27.5 percent in Fiscal 2019 compared to 32.5 percent last year. The lower adjusted tax rate for this year reflects the lower U.S. federal income tax rate following the passage of the Tax Cut and Jobs Act in December 2017, partially offset by the inability to recognize a tax benefit for certain overseas losses.
GAAP earnings from continuing operations were $29.7 million in the fourth quarter of Fiscal 2019, compared to $48.4 million in the fourth quarter last year. Adjusted for the Excluded Items in both periods, fourth quarter earnings from continuing operations were $42.4 million, or $2.18, in Fiscal 2019, compared to earnings from continuing operations of $35.7 million, or $1.85, last year.
Full Year Review
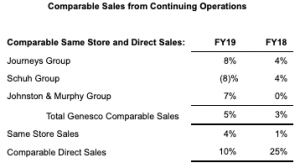
Net sales from continuing operations for Fiscal 2019 increased 3 percent to $2.2 billion from $2.1 billion in Fiscal 2018. Comparable sales from continuing operations increased 5 percent, with stores up 4 percent and direct up 10 percent. Direct-to-consumer sales were 11 percent of total retail sales from continuing operations for the year compared to 10 percent last year.
Comparable Sales from Continuing Operations
Fiscal 2019 gross margin this year was 47.8 percent, up 30 basis points, compared with 47.5 percent last year. The increase as a percentage of sales reflects decreased markdowns for Journeys Group and an increased mix of retail sales for Johnston & Murphy Group, partially offset by increased promotional activity for Schuh Group.
Selling and administrative expense for the year was 44.0 percent, up 30 basis points, compared to 43.7 percent of sales for the same period last year. The increase as a percentage of sales reflects higher bonus accruals, partially offset by the leveraging of occupancy related and other costs.
Genesco’s GAAP operating income for Fiscal 2019 was $81.8 million compared with $74.4 million last year. Adjusted for the Excluded Items in both periods, operating income was $90.7 million this year compared with $82.3 million last year. Adjusted operating margin was 4.1 percent of sales in Fiscal 2019 and 3.9 percent last year.
The effective tax rate was 34.5 percent in Fiscal 2019 compared to 46.8 percent last year. The adjusted tax rate, reflecting Excluded Items, was 27.1 percent in Fiscal 2019 compared to 33.1 percent last year. The lower adjusted tax rate for this year reflects the lower U.S. federal income tax rate following the passage of the Tax Cut and Jobs Act in December 2017, partially offset by the inability to recognize a tax benefit for certain overseas losses.
GAAP earnings from continuing operations were $51.2 million in Fiscal 2019, compared to $36.7 million in Fiscal 2018. Adjusted for the Excluded Items in both periods, earnings from continuing operations were $64.0 million in Fiscal 2019, compared to earnings from continuing operations of $51.4 million last year.
Cash, Borrowings and Inventory
Cash and cash equivalents at February 2, 2019, were $167.4 million, compared with $39.9 million at February 3, 2018. Total debt at the end of the fourth quarter of Fiscal 2019 was $65.7 million compared with $88.4 million at the end of last year’s fourth quarter, a decrease of 26 percent. Inventories decreased 5 percent in the fourth quarter of Fiscal 2019 on a year-over-year basis.
Capital Expenditures and Store Activity
For the fourth quarter, capital expenditures were $8 million, which consisted of $5 million related to store remodels and new stores and $3 million related to direct to consumer, omnichannel, information technology, distribution center and other projects. Depreciation and amortization was $13 million. During the quarter, the company opened eight new stores and closed 33 stores. The company ended the quarter with 1,512 stores compared with 1,535 stores at the end of the fourth quarter last year, or a decrease of 1 percent. Square footage was down 1 percent on a year-over-year basis.
Share Repurchases
For the fourth quarter and year of Fiscal 2019, the company repurchased 968,375 shares for approximately $45.9 million at an average price of $47.45 per share, as part of a $125 million share repurchase program approved by the Board of Directors in December 2018. For the first quarter of Fiscal 2020 through March 8, 2019, the company has repurchased 584,465 shares for approximately $26.4 million at an average price of $45.10 per share, leaving approximately $52.7 million available to repurchase under the current authorization.
Discontinued Operations
On December 14, 2018, the company entered into a definitive agreement for the sale of Lids Sports Group to FanzzLids Holdings, a holding company controlled and operated by affiliates of Ames Watson Capital, LLC.
On February 2, 2019, the company completed the sale of its Lids Sports Group to FanzzLids Holdings for $100 million, which is still subject to working capital and other adjustments. For the fourth quarter ended February 2, 2019, the company recorded a loss of $98.3 million, net of tax, on the sale of these assets, representing the sale price less the value of the Lids Sports Group assets sold and other miscellaneous charges, including divestiture transaction costs, offset by a tax benefit on the loss. This loss is included in the Loss from discontinued operations, net on the Condensed Consolidated Statements of Operations.
Fiscal 2020 Outlook
For Fiscal 2020, the company expects:
• Comparable sales from continuing operations to be up 1 percent to 2 percent, and
• Adjusted diluted earnings per share from continuing operations in the range of $3.35 to $3.75 with an expectation that earnings for the year will be near the midpoint of the range.


